It gets pretty hot during the summer time in lower Delaware as folks enjoy the beautiful weather at the beach. But there is a price to be paid. Most air conditioners are cranked and the grid sees its heaviest load of the year. The grid is under stress and strain. Alerts, such as from the Delaware Electric Coop (DEC) Beat The Peak program, are sent out to help reduce power. The grid operator navigates this electrical storm, and life is good, with toes back in the sand.
But I'm curious. What's going on under the hood? There's a vast forest of systems, all tied together, providing us with our way of life. These systems are at the core of our cleaner energy future. Can we peek under the hood and get a little look into what's happening? We know that the load on the grid is in constant motion. It changes minute to minute, hour to hour and day to day. The price is related to the load and also goes up and down. Can we find out more about what is happening as the energy market does its thing?
As it turns out, local grid data is available online at your nearest internet device. Our mid-Atlantic grid operator, PJM, provides access to a large public grid database online at https://pjm.com. This reservoir of information includes historical data about the loads and prices during 2023, and lots more. It seems absolutely overwhelming. Could AI help unravel this data? What if AI looked at our grid? What would it see? Let's investigate…
OpenAI provides access to a very smart AI called ChatGPT4. (https://openai.com) I have a paid subscription that allows me to upload files and instruct ChatGPT to write code that analyzes the data in the files. (Note that code generation capability is not a standard feature of large AI language models.) I nicknamed her "Katrina". Seems like a marriage made in cyberspace.
I proceeded to download from PJM.com spreadsheet files (in comma separated format) of last year's hourly system load data and hourly Locational Marginal Price (LMP) data from 6/1/2023 to 10/3/2023. The load data is in megawatts and the LMP is the price for the next megawatt-hour of electricity. I think I extracted the correct data but I need someone with a deeper understanding of PJM's data dictionary to confirm it.
I then uploaded the file to ChatGPT4 and instructed Katrina with the following prompt:
"Act like an a very smart data engineer and provide answers that are concise. You have all the mathematical algorithms available to you and want to make the best decisions that you can. The file LMP_LOAD.csv has 3 columns: datetime, price per megawatt hour and load in megawatts. How are price and load related? Show all graphs with both variables superimposed on the same graph with separate Y-axis for each. Show me a statistical summary with minimum, average and maximum values of the load and price and the datetime the minimum and maximum occurred. Then do a regression analysis and correlation coefficients. Show the regression analysis on a graph. What does this imply about the data?"
Katrina responded with:
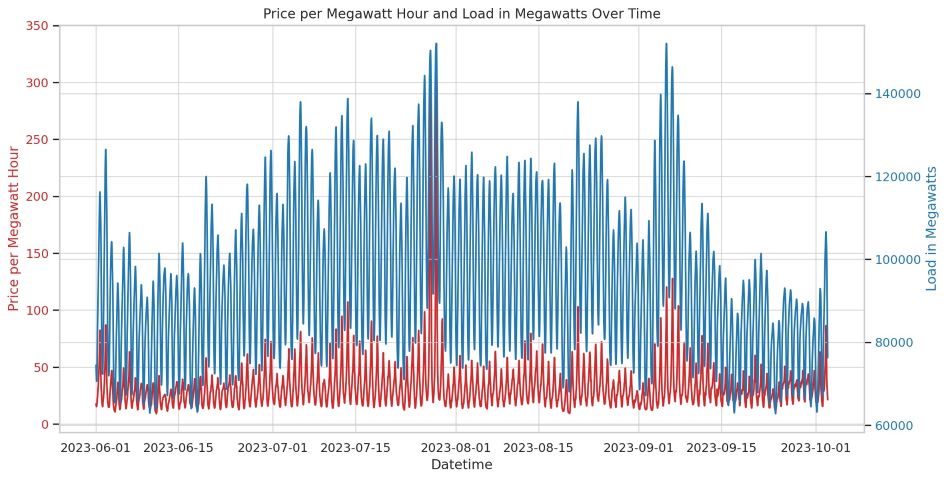
The analysis of the relationship between the price per megawatt-hour and load in megawatts from the provided data reveals the following: Graphical Representation: The graph displaying both variables over time shows a distinct pattern. There appears to be some correlation between the load in megawatts and the price per megawatt-hour, as evident from the trends in the graph.
Statistical Summary Price per MWh: Minimum: $9.14 on 2023-06-11 06:00 Average: $32.36 Maximum: $334.13 on 2023-07-28 17:00 Load in MW: Minimum: 62,765 MW on 2023-09-24 04:00 Average: 95,032 MW Maximum: 152,040 MW on 2023-07-28 16:00
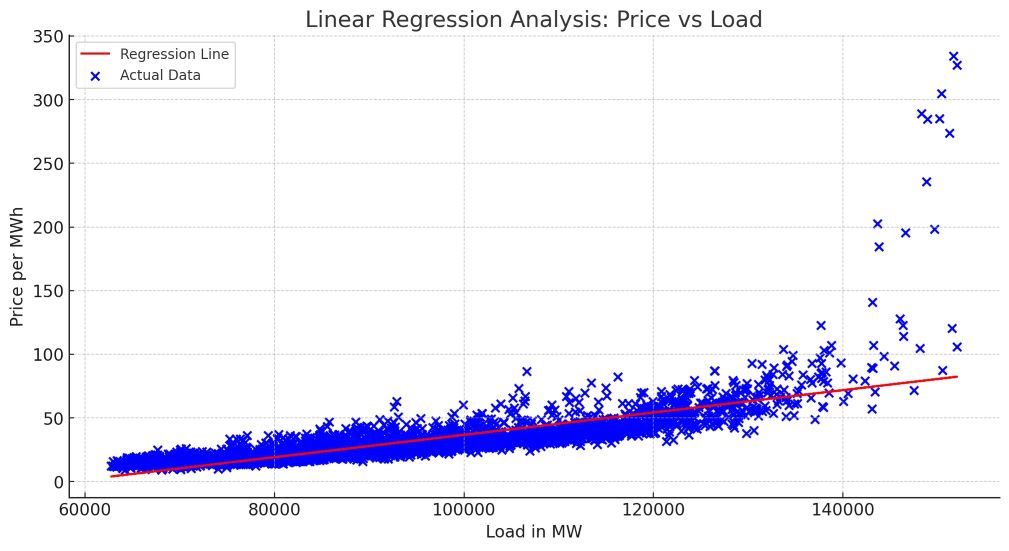
Regression Analysis: The linear regression model suggests a positive relationship between load and price, indicated by a positive slope of approximately 0.00088. The intercept of the regression line is approximately -51.03. The correlation coefficient is 0.741, indicating a strong positive correlation between load and price.
Implications: The positive slope in the regression analysis implies that, generally, as the load in megawatts increases, the price per megawatt-hour tends to increase as well. The strong correlation coefficient supports this, suggesting a significant linear relationship between these two variables. However, it's important to consider other factors that might influence these variables and the potential for non-linear relationships or external influences that are not captured in this analysis.
My human response:
Loading the same file into Excel and using the built-in average, min and max functions: Price Minimum: 9.136 Price Average: 32.359 Price Maximum: 334.131 Load Minimum: 62765 Load Average: 95026.525 Load Maximum: 152040
I'm impressed!! The load average was a tad off but the others are pretty much on the money.
150,000 megawatts is a lot of power! Assuming 2,000 watts per house, that's power for 75 million homes. (Or about 124 Mr. Fusion Reactors from Back to the Future.)
What pops out of the data is that load and price are "kinda/sorta" related to each other, but above a load of about 135,000 megawatts, the price goes "bazinga", as the grid strains under its heavy load. Energy gets expensive at that altitude!
What else can we learn from the grid data?
I next instructed Katrina to:
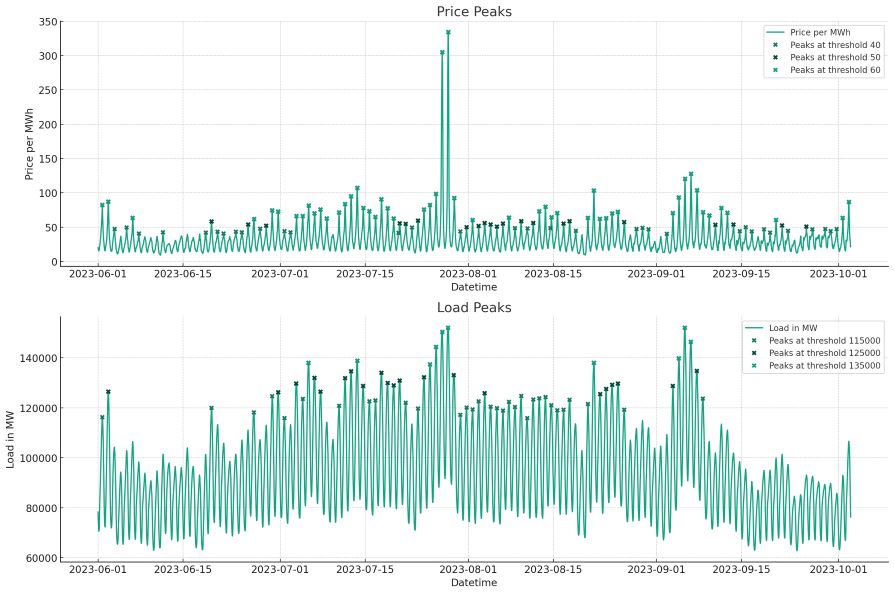
"Write a python program to detect peaks in the load data and the price data. Use the best peak picker you have and include price outliers. Set the price thresholds to 40, 50, and 60 and the load thresholds to 115000, 125000, and 135000. Show me the number of peaks for each threshold. Show a graph of the load peaks and price peaks. Were you able to detect the peak when the maximum price occurred to within 3 hours? If you cannot detect when the maximum price occurred, tell me why. Create a downloadable file with the calculated peak load and peak price data in csv format."
Katrina responded with:
The analysis of peaks in the load and price data yields the following results:
Number of Peaks Detected at Each Threshold Price Peaks: Threshold $40: 106 peaks Threshold $50: 73 peaks Threshold $60: 52 peaks Load Peaks: Threshold 115,000 MW: 63 peaks Threshold 125,000 MW: 31 peaks Threshold 135,000 MW: 10 peaks
Detection of Maximum Price Peak The peak when the maximum price occurred (on 2023-07-28 at 17:00) was successfully detected using the highest price threshold ($60). The closest peak detected to the maximum price time was exactly at the same time, indicating a precise detection.
Peak Data File A CSV file containing the calculated peak load and peak price data has been created. You can download it using the link below: Download Peak Load and Price Data CSV
The graphical representation shows the peaks detected for both load and price, demonstrating the effectiveness of the peak detection algorithm in capturing significant fluctuations in the dataset.
My human response:
Cool!! These results are not verified and I'd be surprised if they were 100% accurate but they seem reasonable. ChatGPT4 is in beta and is only going to get faster and more accurate.
At first glance, the use of OpenAI ChatGPT4 to help understand how the grid operates and detect disturbances along the way looks like a viable approach. Seems to me that this is the time to start seriously experimenting and testing this technology. Let the AI do the heavy lifting and software coding!!
Dialoging with ChatGPT4 is great for learning and analyzing, but an online "Automated Peak Detection Advisory System" using AI agents that could monitor operational data and provide alerts about pending events or situations of interest should bring significant value. AI agents can be built using the OpenAI Assistant API (https://platform.openai.com/). This is the approach I took with the "Personal Advisory Sidekick", https://upperbay.com/v1/blogs/beachblogs/the-personal-advisory-sidekick. I call it "Fun With Agents".
AI is a tool in the toolshed capable of helping us understand complex systems. May it help us get to our clean energy future.